single with man on first (part 3)

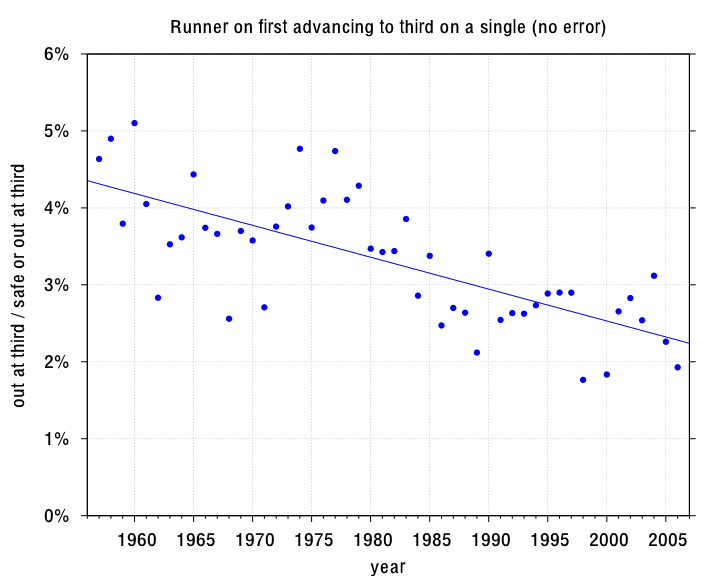
This time I looked at how often runners on first were thrown out at third on a single. Again, no other baserunners. Not counted:

  • Error on the play at third. (Errors allowing the batter to advance past first are OK.)
  • Runner on first out at second or home.
  • Runner safe at home.
  • Baserunner hit by batted ball.

The percentage I’m interested in is the number of times the runner is out at third divided by the number of times the runner is out or safe at third. Again, I counted all the years available in the Retrosheet event files. Graph below. The line is the least-mean-squares linear fit.
single_third_thrownout1.png

I’m surprised how seldom the runner is out at third. There’s a clear downward trend, which indicates that runners and/or third base coaches have become more conservative. Perhaps stronger arms in the outfield are also a factor.

The whole exercise makes me question the role of TPB’s “sending runners” in these situations. (TPB out of the box, not ABL rules.) Why is this a manager’s decision? Runners will try for the extra base on their own, or take guidance from the third base coach. Would it be more realistic to roll for an advancement that is explicitly specified on a chart? Such a chart should be roughly:

  • 26%: runner safe at third
  •  2%: runner out at third
  • 72%: runner holds at second

Then you could sprinkle in some potential errors & such. Of course, there would be a dependency on where the single was hit (as there is now).

single with man on first (part 2)

Previously I looked at the frequency of runners advancing from first to third on a single during the 2006 & 1973 seasons. I extended the analysis by looking at all seasons available from Retrosheet (1957-1998, 2002-2006). A slight change: now I’m counting plays during which the batter went to second on the throw (error or not).

OK, so the chart below shows the percentage of times the runner on first reaches third successfully as a result of:

  • runner on first,
  • no other baserunners,
  • the batter singles, and
  • neither runner put out.

single_first.png

There’s a big spike during the late sixties, then it’s pretty constant from 1970-1995. Since 1995 there’s been a steady decline. Strange!

Next: When runners try for third on a single, how often are they thrown out?

single with man on first

The ABL simplifies runner advancement on singles. I think the only way to go from first to third on a single is on a hit-and-run. This made me wonder about how often runners advance past second on a single. Here’s what I got from the Retrosheet event files for 2006. (single_first.pl) These are singles with a man on first and no other base runners. Advancement on fielding errors counts, but getting thrown out doesn’t.

first to second    4101   (73.5%)
first to third     1473   (26.4%)
first to home         8   ( 0.1%)

About a one-in-four chance to move the man to third. That sounds about right.

Here are the numbers from 1973:

first to second    3270   (68.9%)
first to third     1468   (30.9%)
first to home        10   ( 0.2%)

Why did more guys go from first to third back then?

home-field advantage

One thing caught my eye in the Curve Ball book: batters playing at home hit 12 points better than on the road. Makes sense, but it’s almost as big as the lefty/righty match-up difference, which they say is 15 points. And yet, AFAIK, there are no adjustments in TPB to take home-field advantage into account.

A quick run of the Retrosheet game logs proves the home-field advantage for wins & losses:

              HOME WINS       ROAD WINS
            --------------  --------------
1960-1969    8603 (54.03%)   7319 (45.97%)
1970-1979   10644 (53.78%)   9149 (46.22%)
1980-1989   10995 (54.12%)   9320 (45.88%)
1990-1999   11554 (53.52%)  10033 (46.48%)
2000-2006    9166 (53.93%)   7831 (46.07%)

1960-2006   50962 (53.86%)  43652 (46.14%)

It’s almost 8 points. Not as large as 12, but, of course, there’s more to winning than hitting!

2007-10-07: The Commish’s comment re capturing home-field advantage in Park Effects is very interesting. I might even replace the LHB/RHB categories with home/visitor.

Curve Ball: Baseball, Statistics, and the Role of Chance in the Game

Didn’t expect it, but this book starts out with a simple analysis of All-Star Baseball, APBA, SOM & Sports Illustrated Baseball! Interesting point about the SOM method of splitting the rolls: the batter’s ability is purely additive, that is, there’s no direct interaction with the pitcher. You can get some of that with pitcher symbols in TPB, of course.

More to come…