The outstanding Inside Pitch game offers cards in PDF format.
Just some personal notes here. (I hate perforations!) The goal is to remove the cut lines and get a nice 9×9 grid that minimizes cutting.
The outstanding Inside Pitch game offers cards in PDF format.
Just some personal notes here. (I hate perforations!) The goal is to remove the cut lines and get a nice 9×9 grid that minimizes cutting.
A must-have for Gameday Audio listeners: an AppleScript that mutes the audio during a commercial break or pitching change. Mac only, natch.

How long do starters go, how many relievers, etc.
Here’s the simplest measurement, one obtainable from Retrosheet game logs: the average number of pitchers used in one game by one team.

The DH is certainly a factor from 1973 on, but it looks like it was falling anyway in the two seasons prior.
I wonder if we’ve reached a limit at 4 per game. Might be the max for a 25-man roster.
More to come…
I used to play this back around ’80. Fun stuff.


Check out the video.
They don’t make ’em like this any more!
Here’s a short demo video from the ABL League Office.
Tough draft. Hitting very scarce. Ended up with a weak platoon patchwork. Many picks are really for 2012. Counting on good 2011 MLB performances from the youngsters.
 The new yearbook is available. 137 sides of paper for a sawbuck or the PDF for a fin. Contains a history of the league, records, and a statistical review by yours truly.
With Breen. Cliff Lee shut down the Yanks 8-0. Stats rated it the worst Yankee shutout loss in post-season history. Ouch.

Bud Weiser was from Shamokin. Played 41 games for the Phils in the teens and a couple of seasons with the Triplets in the 20s. The marketing possibilities boggle the mind.
Article and box score from the 1966 Official Baseball Guide about the then-record 27-inning game down the road at Dunn Field. Amazing how few pitchers & position players were used. This game was later surpassed by a 33-inning affair in 1981. Still, the Elmira game might be the longest pro game completed in one day. Belanger and Piniella were to be the big names from this Pioneers team. Earl Weaver piloted the squad.
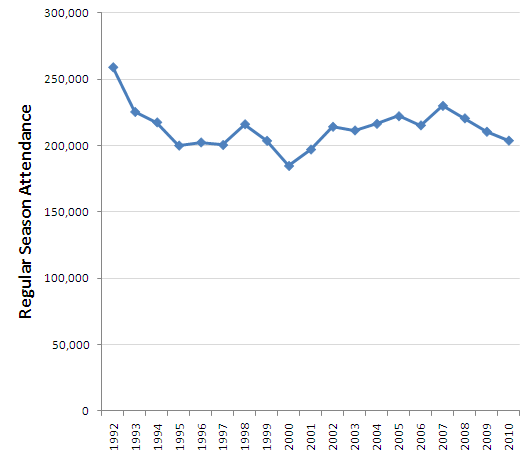
Binghamton Mets attendance throughout franchise history. Now at the bottom of the Eastern League, unfortunately.
TV genius…
The Killer & Neil Sedaka belt it out on Shindig.
 Saw the Mets beat the Braves 3-0 at Tarp Field. [BOX] The former B-Mets did well. Ike Davis hit a 458-foot monster solo shot. Thole had a great, nine-pitch at-bat that culminated in a RBI single. Ruben Tejada went 1-for-three with a walk and made a nice play up the middle to get the last out of the seventh.
In Strat-O-Matic, outfielder errors result in the batter reaching second or third. What kind of errors do outfielders really make?
I looked at the 2,386 errors made in MLB 2005-2009. (From Retrosheet, natch.) That’s about one every five games. I divided them into the five categories shown in the chart below.
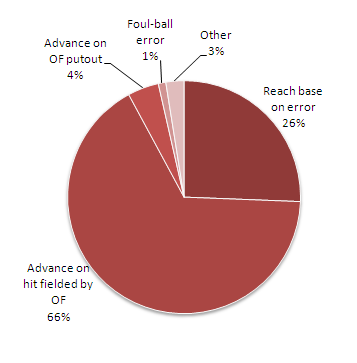
Only a quarter involve the batter reaching base on the error. The majority involve advancement of other baserunners, most after a hit.
A little more detail in the table below, which shows how many bases the batter advanced on the error.

An error that allows the batter to go to second on a single is, by far, the most common occurrence. The table hides a lot of detail, though, like the base situation and the advancement of those other runners.
I learned that the guys who enter the live MLB data are stringers and that they use an app called “Total Baseball.” Found this on the excellent Fungoes Blog. The proprietor there, Pip, does the duty at B*sch. There’s a link there to a good article at THT that describes what these guys do.

A humorous and arresting series of baseball paintings in the style of orange crate labels by artist Ben Sakoguchi.
Joe West’s recent comments prompted me to look at some data I’ve always been curious about. We all know (or think we know) that games have gotten longer, but exactly how has game duration changed over the years?
The Retrosheet Game Logs contain time-of-game data, but the data is very incomplete prior to 1956. (There are also a few data errors, for example, a game that supposedly lasted 413 hours in 1947. I considered everything over 500 minutes to be a data error and ignored it.)
The graph below shows the average game time through the years. All games, extra-inning and less than nine, are included.

What surprised me here was the huge increase from 1944 to 1955, where average game time increased 32 minutes over just eleven years! What happened? More pitching changes was a factor, but I don’t think that can account for it all.
After 1955, things settled down, then in 1979 times started to zoom up again, reaching a new plateau in the late ’80s.
I wanted to look at normal, nine-inning games, but it’s not easy to filter those from the Retrosheet data prior to about 1955. The Game Logs contain the number of outs in the game, so my definition of a normal, nine-inning game is one with 51 to 54 outs. The graph below shows the data for nine-inning games, giving a little more insight into the more recent trends.

Actaully, the average game time has been relatively stable for the last twenty years. Still too long IMHO.


