A couple of pix taken on 2008-08-30. Click on the thumbnails to view.
The interior of current Yankee Stadium: 
The exterior of new Yankee Stadium: 
A couple of pix taken on 2008-08-30. Click on the thumbnails to view.
The interior of current Yankee Stadium:
The exterior of new Yankee Stadium:
While looking for home-run games, I ran across this game, because it came up as a game with no runs, and, therefore, a good candidate for incorrect parsing of the Retrosheet event file. It’s a 0-0 tie between the Mets and the Phillies on Saturday, October 2, 1965 at Shea. It went 18 innings, and, incredibly, each starter went 15 innings! Those are a couple of real baseball players! Let’s meet them, shall we?

Chris Short pitched for 15 years, all but one for Phils. His 132 wins for Philly puts him at #4 on the all-time Phillies win list, trailing only Steve Carlton, Robin Roberts, and Grover Cleveland Alexander.

Rob Gardner was born in Binghamton, NY. 1965 was his first year in the bigs. This game accounted for more than half of his innings pitched in ’65. Garnder nothced only 14 wins over eight seasons with six teams.
So, why was the game stopped? It was the second game of a doubleheader, the last week of the season, and neither team was in contention, but that shouldn’t matter, right? This page talks of a “curfew.” Looks like there used to be a 1 AM curfew in the AL, but maybe this was a legal curfew for kids down in the city?
On the flip side, I saw the last half of the 19-17 Red Sox win over the Rangers last night. Stat of the Day did an entry on it, listing large numbers of runs in a losing effort. The most extreme was this 23-22 Phillies/Cubs game in 1979. Nice. Three homers by Kingman in the losing effort.
2008-12-04: The Phillies/Cubs game is now available at iTMS!

2008-09-15: The Baseball Research Journal has an old article about a 19-inning 0-0 tie. Johnny Vander Meer pitched the first 15 for the Reds.
I was watching a Cardinals game the other day—can’t remember exactly which one—and after a few innings the only runs were off solo homers. I hate games like that. I don’t mind a few taters, but small ball is more fun. It got me wondering: How many games have all their runs knocked in by homers? And how many games have no home runs? I took a guess at both numbers. You have a guess. I’ll wait.
Ready? OK, continue reading.
Continue reading All-HR & no-HR games
Hadn’t been over to The Onion for a while. Now they’ve got baseball coverage! Great stuff.
Custom-perforated stock available from PerforatedPaper.com.
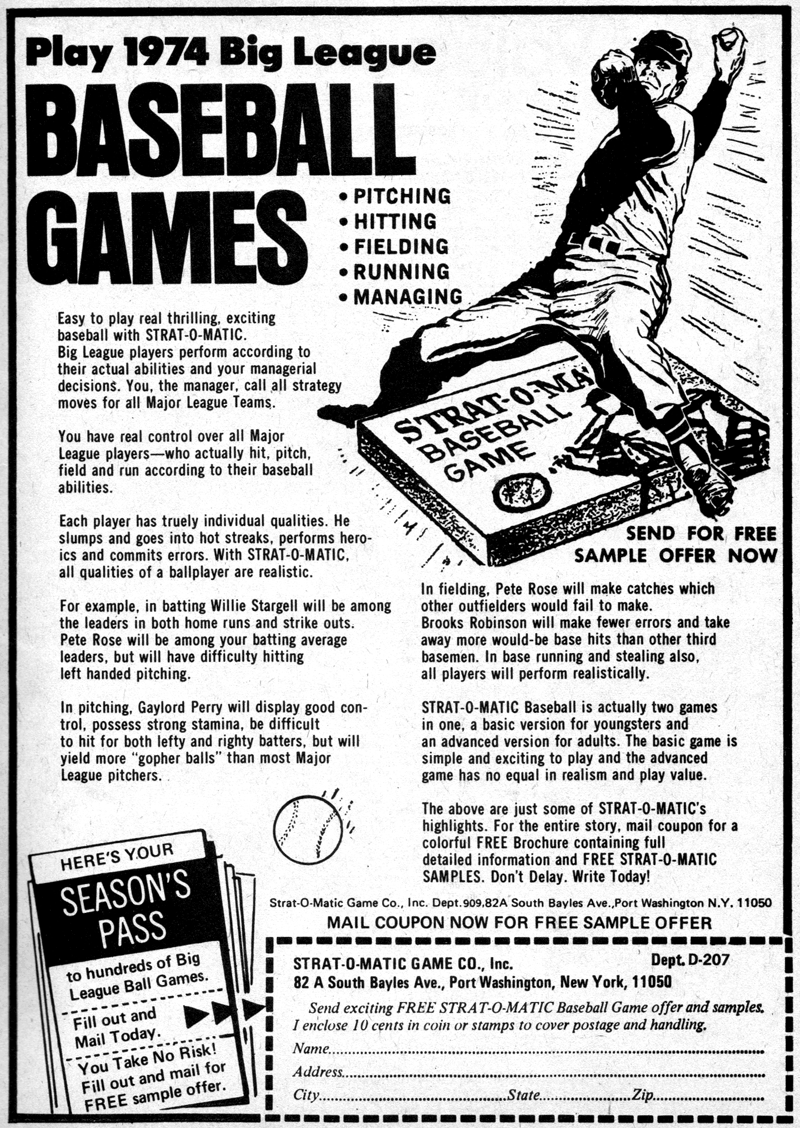
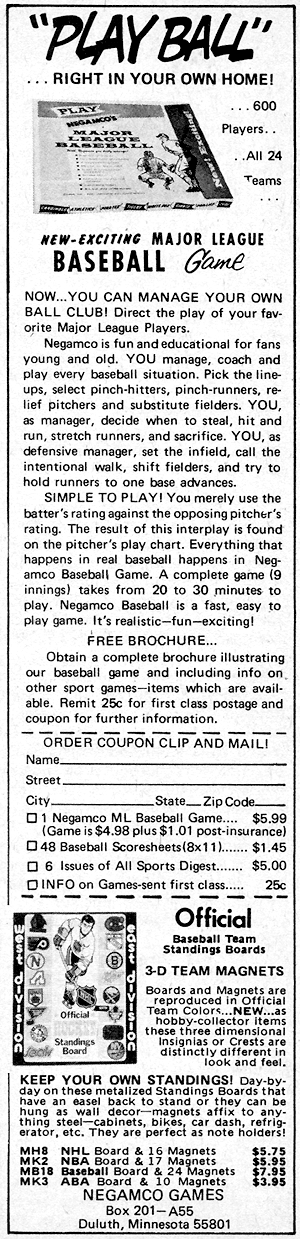
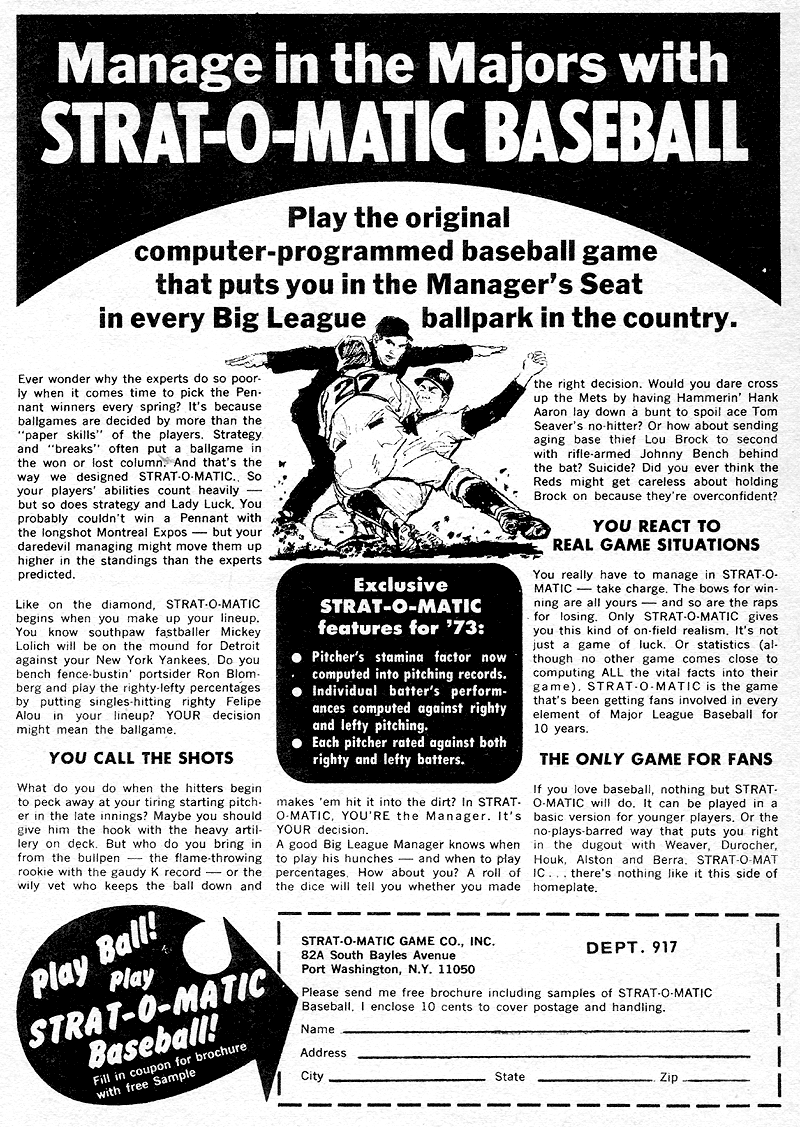
I recently acquired some old baseball mags from the time I started following the game. The 1974 Street & Smith’s yearbook was a particularly important specimen, as it was there I first saw anything about tabletop baseball. The APBA ad must have grabbed my imagination more than the others, because I sent away for their free brochure and sample cards, and soon afterwards ordered the game.
Looking back from 2008, I’m surprised at how many games were advertising. Who runs print ads nowadays?
My favorite bit is in the APBA ad from another energy crunch 35 years ago:

Street & Smith’s 1974 Yearbook:
June 1973 Baseball Digest:
A very old d20. Only $17,925.

SimMatchup plays quick simulated games between any two historical teams.
In 1961 & 1962, the Cubs used a rotating group of managers. Behold the College of Coaches!
Ran across this site that sells double-sided APBA cards—vs. L on one side, vs. R on the other. Seems obvious now, but I certainly never thought of it.
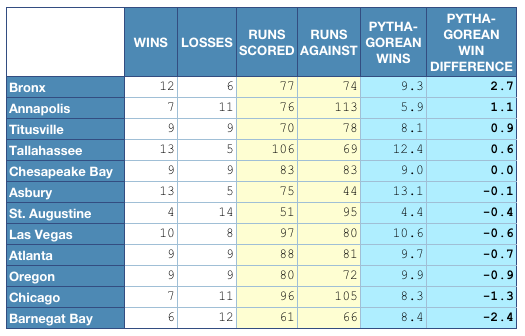
The Pythagorean winning percentage is a measure developed by Bill James to estimate a team’s winning percentage based on runs scored and runs against. (It was named after Pythagoras, the famed Greek Sabermatrician.)
At the half-way point of the ABL regular season, the Pythagorean winning percentages are listed below. (I used the 1.83 exponent used by Baseball Reference.) The results are sorted by Pythagorean wins, the number of wins expected based on the runs scored and runs against.

The difference between the actual wins and the Pythagorean wins is a measure of how “lucky” a team was. It indicates the teams that scored their runs in the situations that won games. And the teams that didn’t. Sorted by Pythagorean win difference, the table below shows the lucky teams at the top and the unlucky ones at the bottom.
The 15 Division B games are complete in the Past Seasons Tournament. The 1964 Phillies took the division.
DIVISION B
                W   L     RS   RA  RD

1964 Phillies   4   1     19    7 +12
1974 Rangers    3   2     23    7 +16
1968 Cardinals  3   2     15   15   0
1966 Dodgers    3   2     10    9  +1
1969 Orioles    2   3     14   21  -7
1976 Royals     0   5     10   32 -22
Digitized copies of Baseball Magazine, 1908-1920, searchable at the site of LA84, a sports foundation endowed by the profits from the 1984 Los Angeles Olympics. (!)
A companion to the average batter card, here is the average pitcher card. This is a bit of a hack—there’s no adjustment between starters & relievers. The pool is 107 pitchers, made up from the best of the draft, the Perfectos, and most pitchers from the teams I’ve played so far.
   vs L                vs R
---------            ---------
500 - 519     WP?    500 - 519
520 - 547  Range IF  520 - 545
548 - 573  Range OF  546 - 573
574 - 599     EF     574 - 603
600 - 616     RG     604 - 617
617 - 642     1B     618 - 645
643 - 669     EF     646 - 675
670 - 686     RG     676 - 690
687 - 704     SG     691 - 705
705 - 707     HB     706 - 711
708 - 734     1B     712 - 739
735 - 753     2B     740 - 755
754 - 776    Deep!   756 - 776
777 - 803  EF/Tired? 777 - 807
804 - 862     K      808 - 867
863 - 914   K/Tired? 868 - 920
915 - 965     BB     921 - 954
966 - 999     DP     955 - 999
Here are the range numbers:
  vs L              vs R
 ------            ------
  20.0      WP?     20.0
  28.4   Range IF   26.2
  25.7   Range OF   27.6
  26.1      EF      30.0
  17.0      RG      14.5
  26.2      1B      27.8
  26.4      EF      30.3
  17.4      RG      14.8
  17.7      SG      15.1
   3.7      HB       5.7
  26.6      1B      28.3
  18.9      2B      15.8
  23.5     Deep!    21.3
  26.7   EF/Tired?  30.7
  59.0      K       60.2
  51.8    K/Tired?  52.7
  50.9      BB      33.7
  34.4      DP      45.2
A beautiful essay by Roger Angell in the New Yorker.
This has come up twice this season. A runner steals second, then, with the same batter at the plate, the runner wants to steal third. The Commish sent out a clarificaiton on 2/13/2008:
Can you steal 2nd base and before the batter swings, steal 3rd base?
ANSWER: No. If the offense attempts a jump for a steal and fails or is successful, the offense must then swing away. The offense isn’t allowed to call a hit and run, bunt, pinch hit, pinch run, steal another base, or make any other moves until the next batter. The defense is also not allowed to make a move until the next batter.
And, yet, consecutive steals of second & third do occur with the same batter at the plate. Questions: 1) How often does it happen in MLB, and 2) could that sequence of events be incorporated into ABL/TPB?
Here’s the definition of the situation. A runner steals second, then, with the same batter at the plate, steals third or is caught stealing third. (I didn’t count straight pick-offs from second.) Per the Retrosheet event files, in 2007 that situation occured 40 times. There were a total of 2,542 steals of second, so the attempt for third occurred 1.6% of the time following a steal of second. The stat for the last five seasons taken together is also 1.6% (185/11,657). So, that answers question 1. Only about one time in every 60 does a runner who has stolen second attempt to steal third with the same batter at the plate.
Does this occur often enough to incorporate into the ABL? I’d say… maybe. It could be added by requiring an extra roll in trying to get the jump to steal third. For example, after the defense is given a chance to set, the offense states that he wants to steal third immediately. If the extra roll allows it, he can try for the jump in the normal way.
So, what should that extra roll be? Let’s assume that the runner would get a normal jump one-third of the time. If the runner always tried to steal third immediately, that would indicate that a 1-in-20 extra roll would produce an attempt once every 60 opportunities, which would reproduce the MLB stats. However, managers will not always try this risky sequence. How often would they try if it were allowed? Stealing seems very lopsided in the ABL (a few players steal all the time, everyone else never steals), so I’ll say 50%. So, if the extra roll requires a zero be rolled with a ten-sided die in order to try for the jump, the percentage of attempts will be: 1/2 manager choice * 1/10 extra roll * 1/3 gets the jump = 1/60, which would reproduce the MLB stat.