This is a description of the player values that I compute for the ABL. I have bits and pieces of the explanation in various places, but thought it would be good to have everything in one place.
The basis of my calculations is linear weights, which is a method for estimating the number of runs produced by a player using the number of each play outcome for the batter. The particular variety of linear weights I use is called Extrapolated Runs. (See note below.) Each outcome is associated with a run value. A home run is 1.44 runs, a single is 0.5 runs, a strikeout is -0.098 runs. Note that the calculation can be done for both batters and pitchers. Of course, good batters will produce more runs, and good pitchers will allow fewer runs.
Now let’s consider a particular batter’s Triple Play Baseball card. If I can estimate the outcomes of each possible roll (000-999), then I can add up the run values (Extrapolated Runs) for each of those outcomes. If I divide that by 1000, then I have an average run estimate for one plate appearance by that batter. Note that I can do the same thing for a particular pitcher’s card.
To get all those outcomes requires a lot of data and a lot of estimates. The data part involves all the numbers in the main area of the card: this much of a home-run range, this much of an easy-fly range, etc. Then we need to create an average pitcher to face each batter, and vice versa. Then we need to estimate the number of times a batter will face righty and lefty arms, then weight those two values appropriately. We need to calculate the average outcomes of range plays and Deeps! But in the end we can get an estimated runs per plate appearance for every player.
Run values do not take into account the following ratings: injury, jump, steal, speed, hold, catcher throw, outfield throw, and double-play turn.
What’s missing at this point is defense. The Range and Error charts can be used to determine the runs saved by a defender using the same linear weights concept. These adjustments can be applied to a particular player, but if that player is carded at multiple positions, then the combined offensive-defensive run estimate is different for each position.
The goal is to calculate a player “value” that is something like WAR (Wins Above Replacement). Replacement players at different positions have different run-producing capacities. That holds true for both MLB and the ABL. For the ABL I set replacement levels close to the estimated run levels of the best available free agents at each position during the regular season. That level of runs at each position becomes the zero point of my calculated player value. The zero-adjusted run values are then scaled such that only the best players have a player value above 100. Players can have negative player values when free agents with higher run estimates are available at a position.
Defensive ability and position value can lead to very different player values for the same player. For example, an average-hitting catcher may have a significant value behind the plate, but a very low value playing first base, especially if his defense at first is FR/8.
Values are adjusted according to the average number of appearances as a full-time pitcher or position player. For example, on average closers will face fewer batters than a starter, so a closer’s value is adjusted down relative to a starter.
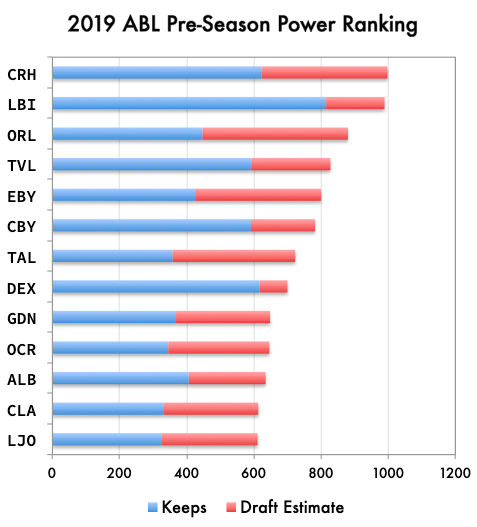
When I total the value of all players on a team, I do not count players with negative player value, because such players are unlikely to get lots of playing time. If a player plays multiple positions, I use the position with the highest value.
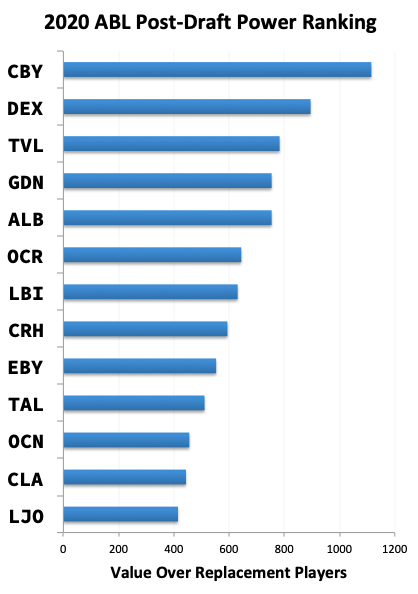
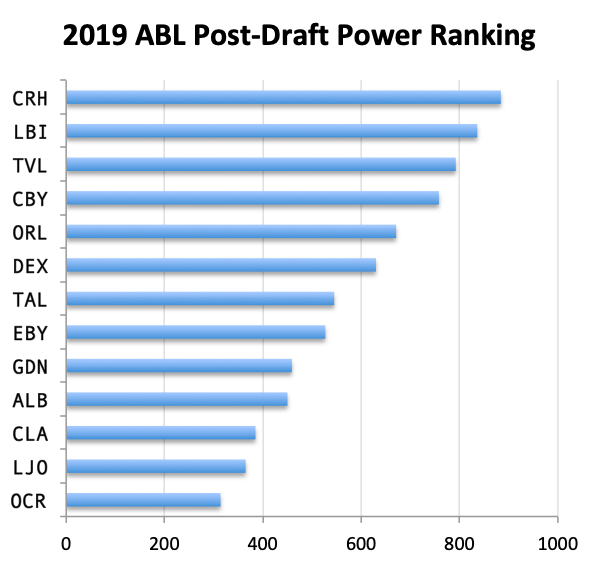
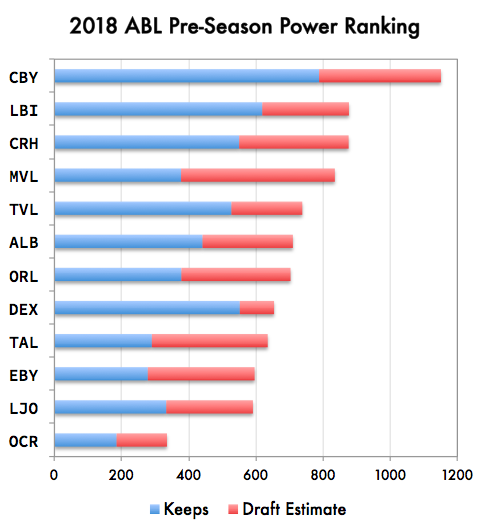
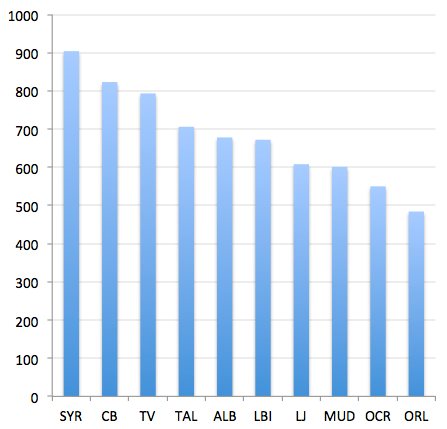
Since all free agents are rated, I can use historical ABL draft data to estimate the player value for various points in the draft.
TL;DR: The numbers and ratings on the cards are used to estimate the frequency of outcomes (single, home run, walk, strikeout, etc.). The outcomes are converted into runs using linear weights. The run estimate is adjusted for defense, then adjusted to a scale with zero indicating that an equivalent free-agent player is available, and 100 indicating an arbitrary superstar level.
A note on Extrapolated Runs
Extrapolated Runs (XR) appealed to me, because it is an estimate of absolute runs, unlike Palmer’s Batting Runs, which is measured relative to an average player. XR also includes double plays, which can be estimated from TPB cards.
The big weakness of XR is that it’s formulated to apply over a large span of seasons, specifically 1955-1997. I don’t find any XR coefficients for single, recent seasons.
Jim Furtado wrote an article about the development of XR in 1999.